When your advisor presents a Propel Financing proposal, there is a lot of information on the screen. Some of it is standard solar stuff. Some of it is specific to how Propel works. This page walks through every section so you know exactly what you're looking at -- and more importantly, what questions to ask.
Sections of a Propel Proposal
The first section of your proposal shows a satellite aerial view of your home with panels laid out on your actual roof. This is not a generic mock-up -- it is generated using satellite imagery and solar modeling software that accounts for your specific roof pitch, orientation, shading, and available panel space.
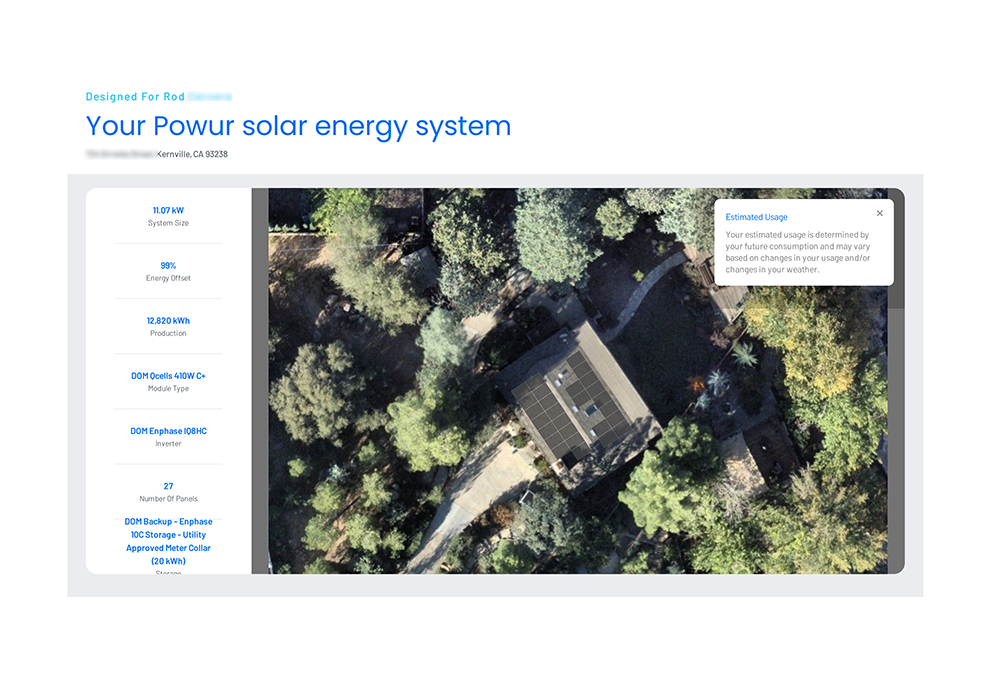 Example: panel layout rendered on the homeowner's actual roof
System size (kW): This is the nameplate capacity of your solar array. A larger number means more panels and more power production. Your system is sized to match your annual consumption as closely as your roof allows.
Energy offset: This is the percentage of your annual electricity consumption that your solar system is projected to cover. A 99% offset means the system is designed to produce nearly as much electricity as you consume each year. Because of how NEM 3.0 net metering works in California, hitting 100% or higher is not always the optimal target -- your advisor will explain the right offset for your utility and rate plan.
Hardware: Propel installations through Solar-Advisors.org use Qcells 410W solar panels and Enphase IQ8HC microinverters. Qcells is a Tier 1 panel manufacturer with strong warranty backing. Enphase microinverters optimize each panel independently, meaning shading on one panel does not drag down the output of the whole array.
This section shows a bar chart comparing your estimated monthly solar production (in blue) against your estimated monthly electricity consumption (in gray) across all 12 months of the year.
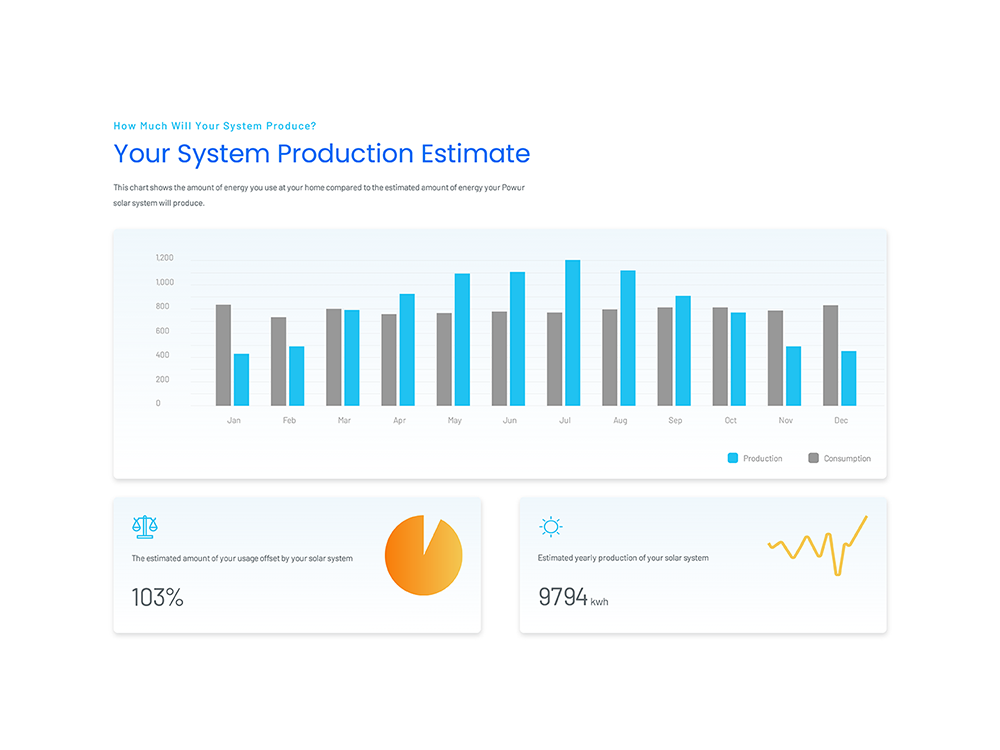 Example: monthly production vs. consumption from a real California proposal
Why it doesn't match perfectly every month: Solar production peaks in summer (longer days, more direct sunlight) and dips in winter. Your consumption may follow a different pattern depending on whether you have air conditioning, heat, an EV, or other seasonal loads. What matters is how the two lines balance out over a full 12-month cycle.
The 99% offset in context: A 99% annual offset means that when you add up all 12 months of production and all 12 months of consumption, the system produces approximately 99% of what you use. In summer months, you may produce more than you consume and bank credits with your utility. In winter, you may draw from those credits. Under NEM 3.0, the credit rates are lower than they were under NEM 2.0, which is why system sizing strategy has changed -- your advisor will walk through the net billing math specific to your utility.
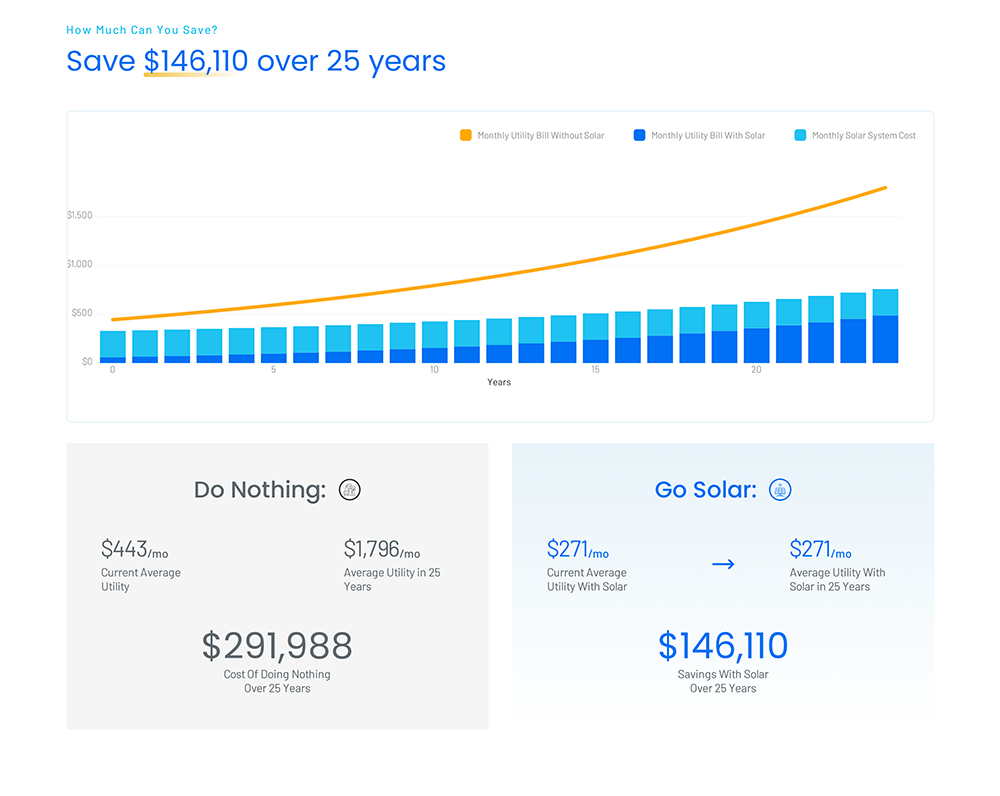
This is the head-to-head comparison that shows what staying on the utility actually costs you versus what your Propel payment would be. For the example below, we're using a real California homeowner's proposal numbers.
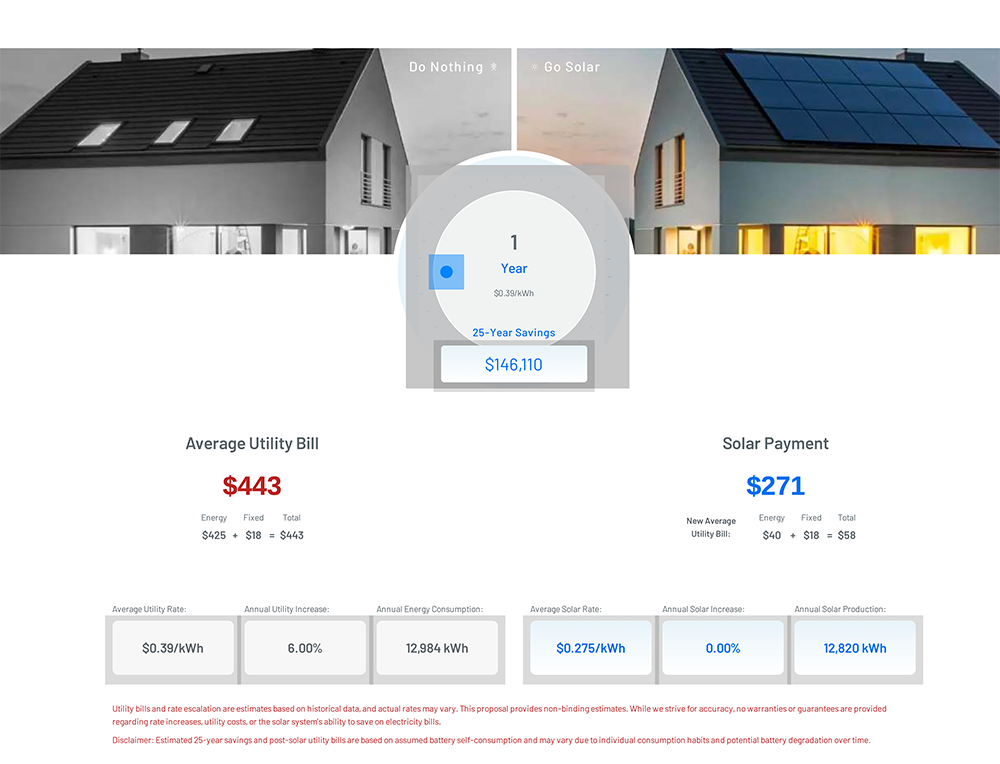 Example: do-nothing utility bill compared to a fixed Propel payment
The $443 is the current average utility bill. The $271 is the Propel monthly payment -- fixed, never escalating. The homeowner's residual utility bill (the fixed charges you still pay to remain grid-connected, currently $40 in energy + $18 fixed charges = $58) is shown separately.
The escalation problem: The utility side doesn't stay at $443. California utilities have raised rates approximately 6 percent per year on average. At that rate, a $443 bill today is projected to grow to over $1,700 per month by year 25. The Propel payment stays at $271 the entire time. That growing gap is where most of your 25-year savings come from.
Key inputs shown in this section:
This is the most important section of the proposal from a financial standpoint. It shows where your monthly payment comes from and why it is lower than what a traditional solar loan would produce for the same system.
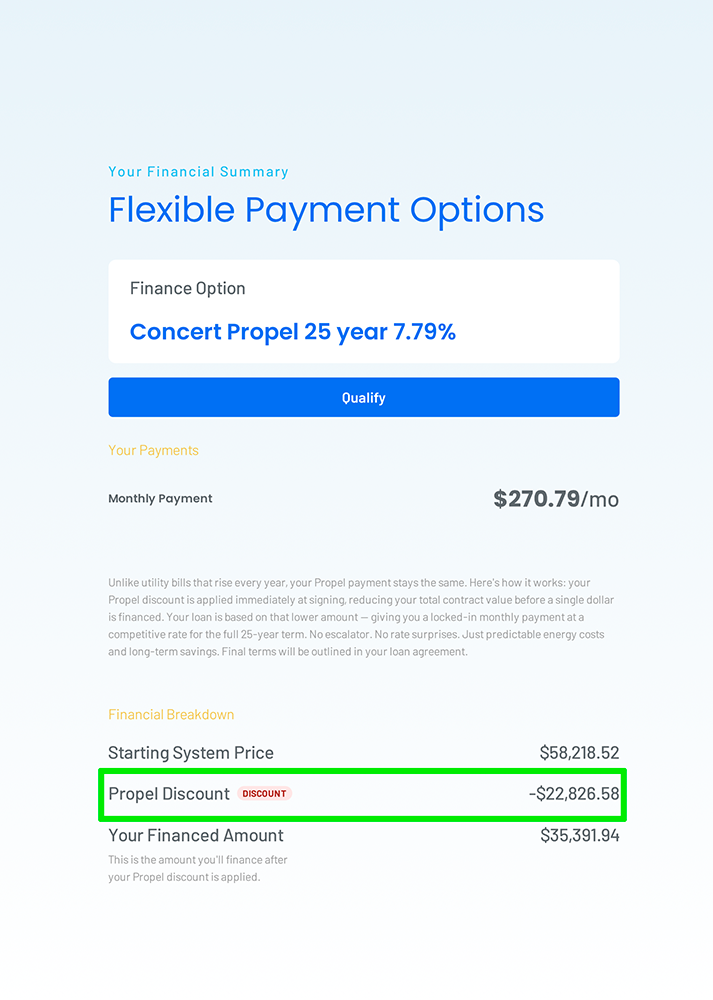 How the Propel discount lowers your financed amount before any interest is applied
How the Propel Numbers Work (Real Example)
The Propel discount: Concert Finance holds temporary commercial ownership of your system during years one through five. That structure lets them access federal commercial clean energy tax credits and accelerated depreciation that residential homeowners cannot access directly. The value of those credits is passed to you as the Propel discount -- in this case, $22,827, or 39.2% of the system cost. That discount reduces your loan principal before a single dollar is financed.
Why this matters vs. a traditional loan: A traditional solar loan for the same $58,218 system would finance the full amount (or more, including dealer fee markup). At the same 7.79% rate over 25 years, that would produce a monthly payment around $437. The Propel discount saves this homeowner $166 per month compared to a standard loan -- for the same system.
The interest rate: Propel rates vary by credit tier. The 7.79% rate shown here is for a specific credit profile. Your rate will be confirmed at the time of your Concert Finance application. Because your loan principal is already 39% lower before the rate is applied, the effective cost of financing is significantly better than the headline rate comparison with traditional lenders suggests.
The 25-year chart shows two lines over time: the cumulative cost of staying on the utility (paying rising bills every year for 25 years), and the cumulative net savings of going solar with Propel. The gap between those two lines, at year 25, is your total projected savings.
 Cumulative utility costs versus cumulative Propel savings over 25 years
How to read the break-even: In the early years of your Propel loan, you are paying $271/month while your utility bill equivalent would have been $443/month. The immediate monthly savings are $172. Even accounting for the loan principal you're still paying down, the break-even point -- where your total cumulative savings exceed your total loan payments to date -- typically hits around year 10 to 11 for most California homeowners. After that, savings compound rapidly.
What happens at year 5: Ownership of the system transfers to you. From that point, the system adds to your home's appraised value and continues producing electricity for the remaining 20 years of the loan term -- and well beyond. Most Qcells panels carry 25-year performance warranties and are expected to produce for 30 years or more at gradually declining efficiency.
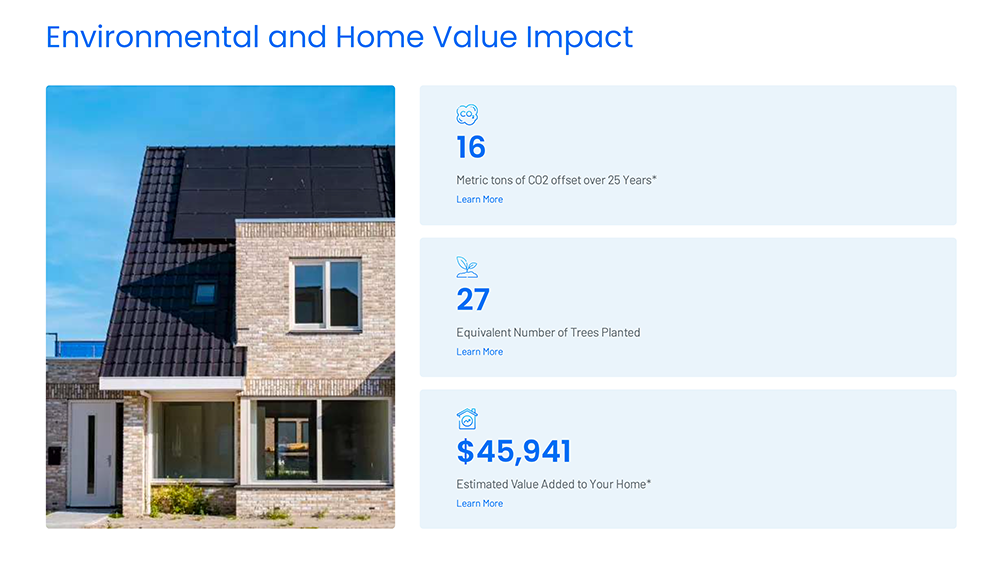
This section of the proposal shows three additional benefits beyond the monthly payment savings: CO2 offset, equivalent trees planted, and estimated home value added.
 Environmental and home value benefits from a typical California Propel system
Home value: The $45,941 home value estimate is based on research showing that California homes with solar sell for a meaningful premium over comparable non-solar homes. The estimate is approximate and not guaranteed -- actual value added depends on your market, buyer preferences, and whether the system is owned or under a lease/PPA at the time of sale. With Propel, ownership transfers at year five, which means from that point the system is unencumbered equity-adding equipment, not a lease obligation a buyer has to assume.
Before year five: During the first five years while Concert Finance holds commercial title, the system is not yet fully owned by you. However, buyers can still assume the Propel loan, and the home benefits from lower utility costs -- which buyers and appraisers increasingly factor into value. Your advisor can walk through how this affects any planned sale in the near term.
Once you approve your Propel proposal and sign your Concert Finance loan agreement, the installation process begins. Here is what to expect at each stage:
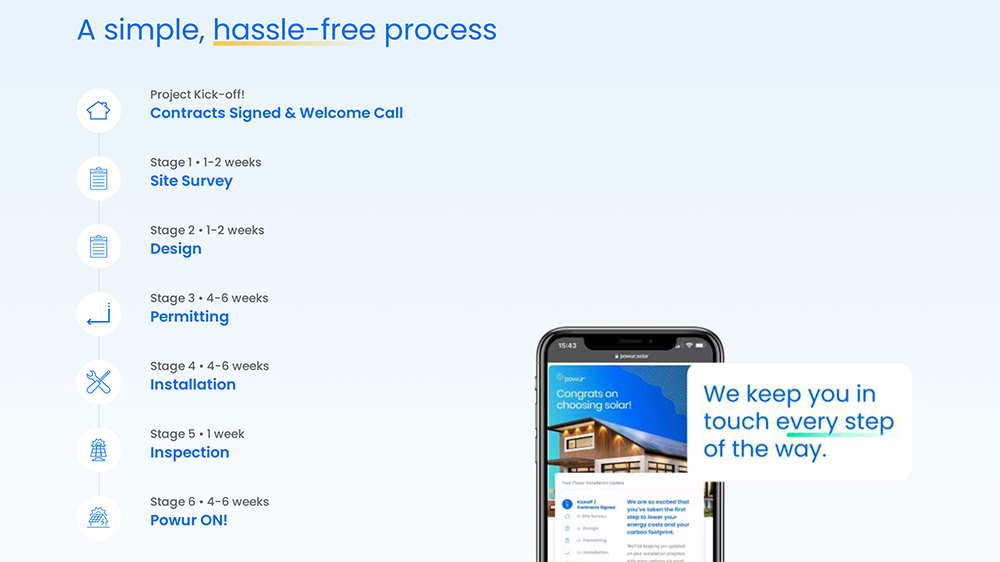 From contract signed to Propel ON: the full installation timeline at a glance
Ready to See Your Own Propel Numbers?
Your proposal is built from satellite imagery of your actual roof, your local utility rate, and your real energy usage. Takes about 2 minutes to get started. No credit check, no obligation.
Get My Free Propel Proposal →